TF analysis for single-cell multimodal PBMC
[1]:
import os
import numpy as np
import pandas as pd
import scanpy as sc
import anndata as ad
import muon as mu
from muon import atac as ac
from pyjaspar import jaspardb
import pychromvar as pc
[2]:
pc.__version__
[2]:
'0.0.2'
download data
[3]:
!wget https://cf.10xgenomics.com/samples/cell-arc/2.0.0/pbmc_granulocyte_sorted_3k/pbmc_granulocyte_sorted_3k_filtered_feature_bc_matrix.h5
--2023-01-28 05:38:05--  https://cf.10xgenomics.com/samples/cell-arc/2.0.0/pbmc_granulocyte_sorted_3k/pbmc_granulocyte_sorted_3k_filtered_feature_bc_matrix.h5
Resolving cf.10xgenomics.com (cf.10xgenomics.com)... 104.18.0.173, 104.18.1.173, 2606:4700::6812:ad, ...
Connecting to cf.10xgenomics.com (cf.10xgenomics.com)|104.18.0.173|:443... connected.
HTTP request sent, awaiting response... 200 OK
Length: 38844318 (37M) [binary/octet-stream]
Saving to: ‘pbmc_granulocyte_sorted_3k_filtered_feature_bc_matrix.h5’

pbmc_granulocyte_so 100%[===================>]  37.04M   101MB/s    in 0.4s

2023-01-28 05:38:05 (101 MB/s) - ‘pbmc_granulocyte_sorted_3k_filtered_feature_bc_matrix.h5’ saved [38844318/38844318]
Loda data as Mudata object
[4]:
mdata = mu.read_10x_h5("pbmc_granulocyte_sorted_3k_filtered_feature_bc_matrix.h5")
/home/rs619065/miniconda3/envs/r-4.1/lib/python3.8/site-packages/anndata/_core/anndata.py:1830: UserWarning: Variable names are not unique. To make them unique, call `.var_names_make_unique`.
  utils.warn_names_duplicates("var")
Added `interval` annotation for features from pbmc_granulocyte_sorted_3k_filtered_feature_bc_matrix.h5
/home/rs619065/miniconda3/envs/r-4.1/lib/python3.8/site-packages/mudata/_core/mudata.py:446: UserWarning: var_names are not unique. To make them unique, call `.var_names_make_unique`.
  warnings.warn(
[5]:
mdata.var_names_make_unique()
Quality control of RNA-seq data
[6]:
# compute quality
mdata['rna'].var['mt'] = mdata['rna'].var_names.str.startswith('MT-')
sc.pp.calculate_qc_metrics(mdata['rna'], qc_vars=['mt'], percent_top=None, log1p=False, inplace=True)

# control quality
mu.pp.filter_var(mdata['rna'], 'n_cells_by_counts', lambda x: x >= 3)
mu.pp.filter_obs(mdata['rna'], 'n_genes_by_counts', lambda x: (x >= 200) & (x < 5000))
mu.pp.filter_obs(mdata['rna'], 'total_counts', lambda x: x < 15000)
mu.pp.filter_obs(mdata['rna'], 'pct_counts_mt', lambda x: x < 20)
Quality control of ATAC-seq data
[7]:
sc.pp.calculate_qc_metrics(mdata['atac'], percent_top=None, log1p=False, inplace=True)

mu.pp.filter_var(mdata['atac'], 'n_cells_by_counts', lambda x: x >= 50)
mu.pp.filter_obs(mdata['atac'], 'n_genes_by_counts', lambda x: (x >= 2000) & (x <= 15000))
mu.pp.filter_obs(mdata['atac'], 'total_counts', lambda x: (x >= 4000) & (x <= 40000))
only keep cells that pass the control for both modalities
[8]:
mu.pp.intersect_obs(mdata)
Data normalization and PCA for RNA
[9]:
mdata['rna'].layers["counts"] = mdata['rna'].X.copy()
sc.pp.normalize_total(mdata['rna'], target_sum=1e4)
sc.pp.log1p(mdata['rna'])

sc.pp.highly_variable_genes(mdata['rna'], min_mean=0.02, max_mean=4, min_disp=0.5)
sc.pp.scale(mdata['rna'], max_value=10)
sc.tl.pca(mdata['rna'], svd_solver='arpack')
Data normalization and LSI for ATAC
[10]:
mdata['atac'].layers["counts"] = mdata['atac'].X
ac.pp.tfidf(mdata['atac'], scale_factor=None)
ac.tl.lsi(mdata['atac'])
mdata['atac'].obsm['X_lsi'] = mdata['atac'].obsm['X_lsi'][:,1:]
mdata['atac'].varm["LSI"] = mdata['atac'].varm["LSI"][:,1:]
mdata['atac'].uns["lsi"]["stdev"] = mdata['atac'].uns["lsi"]["stdev"][1:]
Multi-modal data integration of RNA/ATAC with WNN analysis
[11]:
sc.pp.neighbors(mdata['rna'], n_neighbors=10, n_pcs=20)
sc.pp.neighbors(mdata['atac'], use_rep="X_lsi", n_neighbors=10, n_pcs=20)
mu.pp.neighbors(mdata, key_added='wnn')
/home/rs619065/miniconda3/envs/r-4.1/lib/python3.8/site-packages/pynndescent/pynndescent_.py:334: NumbaWarning: Cannot cache compiled function "generate_leaf_updates" as it uses dynamic globals (such as ctypes pointers and large global arrays)
  init_rp_tree(data, dist, current_graph, leaf_array)
/home/rs619065/miniconda3/envs/r-4.1/lib/python3.8/site-packages/pynndescent/pynndescent_.py:334: NumbaWarning: Cannot cache compiled function "init_rp_tree" as it uses dynamic globals (such as ctypes pointers and large global arrays)
  init_rp_tree(data, dist, current_graph, leaf_array)
/home/rs619065/miniconda3/envs/r-4.1/lib/python3.8/site-packages/pynndescent/pynndescent_.py:336: NumbaWarning: Cannot cache compiled function "init_random" as it uses dynamic globals (such as ctypes pointers and large global arrays)
  init_random(n_neighbors, data, current_graph, dist, rng_state)
/home/rs619065/miniconda3/envs/r-4.1/lib/python3.8/site-packages/pynndescent/pynndescent_.py:346: NumbaWarning: Cannot cache compiled function "generate_graph_updates" as it uses dynamic globals (such as ctypes pointers and large global arrays)
  nn_descent_internal_low_memory_parallel(
/home/rs619065/miniconda3/envs/r-4.1/lib/python3.8/site-packages/pynndescent/pynndescent_.py:346: NumbaWarning: Cannot cache compiled function "process_candidates" as it uses dynamic globals (such as ctypes pointers and large global arrays)
  nn_descent_internal_low_memory_parallel(
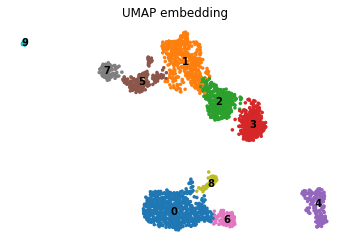
We can visualize the cells in this integrated space
[12]:
mu.tl.umap(mdata, neighbors_key='wnn', random_state=10)
mdata.obsm["X_wnn_umap"] = mdata.obsm["X_umap"]

sc.tl.leiden(mdata, resolution=.3, neighbors_key='wnn', key_added='leiden_wnn')
mu.pl.umap(mdata, color=['leiden_wnn'], frameon=False, title="UMAP embedding", legend_loc="on data")
Add the clustering results to RNA and ATAC modality
[13]:
# add the clustering results to chromvar modality
mdata['rna'].obs['leiden_wnn'] = mdata.obs['leiden_wnn']
mdata['atac'].obs['leiden_wnn'] = mdata.obs['leiden_wnn']
Perform differential expression analysis
[14]:
sc.tl.rank_genes_groups(mdata['rna'], 'leiden_wnn', method='wilcoxon')
pd.DataFrame(mdata['rna'].uns['rank_genes_groups']['names']).head(10)
... storing 'feature_types' as categorical
... storing 'genome' as categorical
... storing 'interval' as categorical
/home/rs619065/miniconda3/envs/r-4.1/lib/python3.8/site-packages/scanpy/tools/_rank_genes_groups.py:420: RuntimeWarning: invalid value encountered in log2
  self.stats[group_name, 'logfoldchanges'] = np.log2(
[14]:
| 0 | 1 | 2 | 3 | 4 | 5 | 6 | 7 | 8 | 9 | |
|---|---|---|---|---|---|---|---|---|---|---|
| 0 | DPYD | IL32 | FHIT | LEF1 | BANK1 | CCL5 | FCGR3A | GNLY | HLA-DPB1 | PTPRS |
| 1 | PLXDC2 | LTB | LEF1 | BACH2 | RALGPS2 | NKG7 | IFITM3 | PRF1 | HLA-DRA | TCF4 |
| 2 | NEAT1 | INPP4B | BCL11B | THEMIS | MS4A1 | GZMA | LST1 | NKG7 | HLA-DPA1 | LINC01374 |
| 3 | LRMDA | EEF1A1 | MALAT1 | NELL2 | AFF3 | CST7 | AIF1 | CD247 | CST3 | IRF8 |
| 4 | FCN1 | IL7R | CAMK4 | CD8B | PAX5 | CTSW | SERPINA1 | KLRD1 | HLA-DRB1 | ZFAT |
| 5 | JAK2 | ITGB1 | BACH2 | PDE3B | CD74 | IL32 | TCF7L2 | GZMA | CD74 | FCHSD2 |
| 6 | VCAN | TPT1 | INPP4B | OXNAD1 | CD79A | PRF1 | FCER1G | CTSW | FLT3 | LINC00996 |
| 7 | SLC8A1 | RPL41 | OXNAD1 | CD8A | LINC00926 | A2M | PSAP | CST7 | HLA-DRB5 | CUX2 |
| 8 | ARHGAP26 | TRAC | TCF7 | CCR7 | IGHM | GNLY | IFI30 | SPON2 | HLA-DQA1 | PLD4 |
| 9 | DENND1A | RPS18 | ANK3 | TXK | CD79B | HCST | CST3 | GZMB | GAPDH | CCDC50 |
Motif analysis with pychromVAR
We first download the genome sequence, here hg38 is used.
[15]:
pc.get_genome("hg38", output_dir="./")
Pre-processing data and perform motif matching
[16]:
mdata['atac'].X = mdata['atac'].layers["counts"]

pc.add_peak_seq(mdata, genome_file="./hg38.fa", delimiter=":|-")
pc.add_gc_bias(mdata)
pc.get_bg_peaks(mdata)

# get motifs
jdb_obj = jaspardb(release='JASPAR2020')
motifs = jdb_obj.fetch_motifs(
    collection = 'CORE',
    tax_group = ['vertebrates'])

pc.match_motif(mdata, motifs=motifs)
100%|██████████| 62871/62871 [00:00<00:00, 67751.41it/s]
100%|██████████| 62871/62871 [00:00<00:00, 86294.72it/s]
100%|██████████| 62871/62871 [00:47<00:00, 1320.46it/s]
[17]:
mdata
[17]:
MuData object with n_obs × n_vars = 2391 × 134920
  obs:      'leiden_wnn'
  var:      'gene_ids', 'feature_types', 'genome', 'interval'
  obsm:     'X_umap', 'X_wnn_umap'
  obsp:     'wnn_distances', 'wnn_connectivities'
  2 modalities
    rna:    2391 x 21256
      obs:  'n_genes_by_counts', 'total_counts', 'total_counts_mt', 'pct_counts_mt', 'leiden_wnn'
      var:  'gene_ids', 'feature_types', 'genome', 'interval', 'mt', 'n_cells_by_counts', 'mean_counts', 'pct_dropout_by_counts', 'total_counts', 'highly_variable', 'means', 'dispersions', 'dispersions_norm', 'mean', 'std'
      uns:  'log1p', 'hvg', 'pca', 'neighbors', 'rank_genes_groups'
      obsm: 'X_pca'
      varm: 'PCs'
      layers:       'counts'
      obsp: 'distances', 'connectivities'
    atac:   2391 x 62871
      obs:  'n_genes_by_counts', 'total_counts', 'leiden_wnn'
      var:  'gene_ids', 'feature_types', 'genome', 'interval', 'n_cells_by_counts', 'mean_counts', 'pct_dropout_by_counts', 'total_counts', 'gc_bias'
      uns:  'lsi', 'neighbors', 'peak_seq', 'motif_name'
      obsm: 'X_lsi'
      varm: 'LSI', 'bg_peaks', 'motif_match'
      layers:       'counts'
      obsp: 'distances', 'connectivities'
[18]:
dev = pc.compute_deviations(mdata)
dev
2023-01-28 05:46:47 INFO     computing expectation reads per cell and peak...
2023-01-28 05:46:47 INFO     computing observed motif deviations...
2023-01-28 05:46:47 INFO     computing background deviations...
[18]:
AnnData object with n_obs × n_vars = 2391 × 746
We can add it to mdata as another modality
[19]:
mdata.mod['chromvar'] = dev
mdata.mod['chromvar'].raw = dev
Then we can analysis and visualize the motif variability as if they are RNA-seq data
[20]:
# add the clustering results to chromvar modality
mdata['chromvar'].obs['leiden_wnn'] = mdata.obs['leiden_wnn']
We can perform differential analysis to identify marker motifs for each cluster
[21]:
sc.tl.rank_genes_groups(mdata['chromvar'], 'leiden_wnn', method='wilcoxon', use_raw=True)
/home/rs619065/miniconda3/envs/r-4.1/lib/python3.8/site-packages/scanpy/tools/_rank_genes_groups.py:420: RuntimeWarning: invalid value encountered in log2
  self.stats[group_name, 'logfoldchanges'] = np.log2(
Print the top10 motifs per cluster:
[22]:
pd.DataFrame(mdata['chromvar'].uns['rank_genes_groups']['names']).head(10)
[22]:
| 0 | 1 | 2 | 3 | 4 | 5 | 6 | 7 | 8 | 9 | |
|---|---|---|---|---|---|---|---|---|---|---|
| 0 | MA0501.1.MAF::NFE2 | MA0769.2.TCF7 | MA0523.1.TCF7L2 | MA0523.1.TCF7L2 | MA0627.2.POU2F3 | MA0800.1.EOMES | MA1111.1.NR2F2 | MA0800.1.EOMES | MA0081.2.SPIB | MA1100.2.ASCL1 |
| 1 | MA0150.2.Nfe2l2 | MA1513.1.KLF15 | MA0768.1.LEF1 | MA0768.1.LEF1 | MA1115.1.POU5F1 | MA0690.1.TBX21 | MA0687.1.SPIC | MA0688.1.TBX2 | MA0080.5.SPI1 | MA1635.1.BHLHE22(var.2) |
| 2 | MA0089.2.NFE2L1 | MA0139.1.CTCF | MA0769.2.TCF7 | MA0769.2.TCF7 | MA0792.1.POU5F1B | MA0688.1.TBX2 | MA0598.3.EHF | MA0690.1.TBX21 | MA1508.1.IKZF1 | MA0500.2.MYOG |
| 3 | MA0833.2.ATF4 | MA0511.2.RUNX2 | MA0632.2.TCFL5 | MA0006.1.Ahr::Arnt | MA0507.1.POU2F2 | MA0802.1.TBR1 | MA0859.1.Rarg | MA0802.1.TBR1 | MA1652.1.ZKSCAN5 | MA0816.1.Ascl2 |
| 4 | MA0838.1.CEBPG | MA0685.1.SP4 | MA1421.1.TCF7L1 | MA1421.1.TCF7L1 | MA0785.1.POU2F1 | MA0803.1.TBX15 | MA0017.2.NR2F1 | MA0803.1.TBX15 | MA0598.3.EHF | MA1467.1.ATOH1(var.2) |
| 5 | MA0836.2.CEBPD | MA0481.3.FOXP1 | MA0006.1.Ahr::Arnt | MA0442.2.SOX10 | MA0789.1.POU3F4 | MA1567.1.TBX6 | MA0136.2.ELF5 | MA0689.1.TBX20 | MA0640.2.ELF3 | MA0832.1.Tcf21 |
| 6 | MA1633.1.BACH1 | MA1683.1.FOXA3 | MA1650.1.ZBTB14 | MA0103.3.ZEB1 | MA0784.1.POU1F1 | MA0689.1.TBX20 | MA1508.1.IKZF1 | MA1567.1.TBX6 | MA0687.1.SPIC | MA0048.2.NHLH1 |
| 7 | MA0102.4.CEBPA | MA0768.1.LEF1 | MA0732.1.EGR3 | MA0139.1.CTCF | MA0787.1.POU3F2 | MA1566.1.TBX3 | MA0160.1.NR4A2 | MA0805.1.TBX1 | MA0645.1.ETV6 | MA1472.1.BHLHA15(var.2) |
| 8 | MA1636.1.CEBPG(var.2) | MA0042.2.FOXI1 | MA0162.4.EGR1 | MA0162.4.EGR1 | MA0786.1.POU3F1 | MA0805.1.TBX1 | MA0080.5.SPI1 | MA0801.1.MGA | MA0517.1.STAT1::STAT2 | MA0698.1.ZBTB18 |
| 9 | MA0496.3.MAFK | MA0850.1.FOXP3 | MA1102.2.CTCFL | MA1102.2.CTCFL | MA0788.1.POU3F3 | MA0801.1.MGA | MA0081.2.SPIB | MA1566.1.TBX3 | MA0473.3.ELF1 | MA0521.1.Tcf12 |
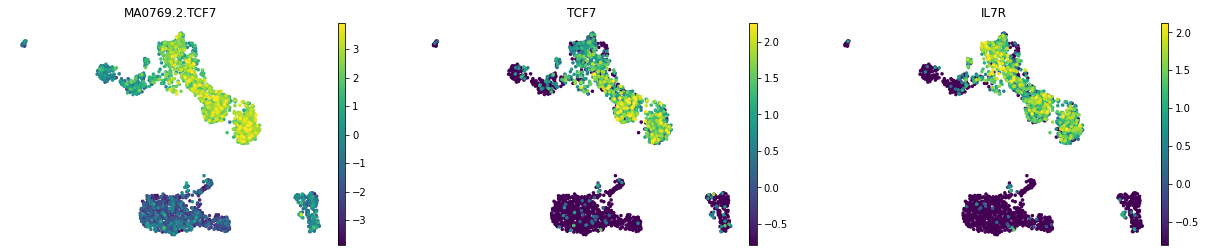
We can visualize the motif activity and gene expression at the same time.
[23]:
mu.pl.umap(mdata, color=['MA0769.2.TCF7', 'TCF7', "IL7R"], frameon=False, vmin='p1', vmax='p99')
[ ]: